Descriptive and Inferential Statistics
Plots
Charts
Tables
Summary Statistics
Distribution
Trends
Outliers
Boxplots

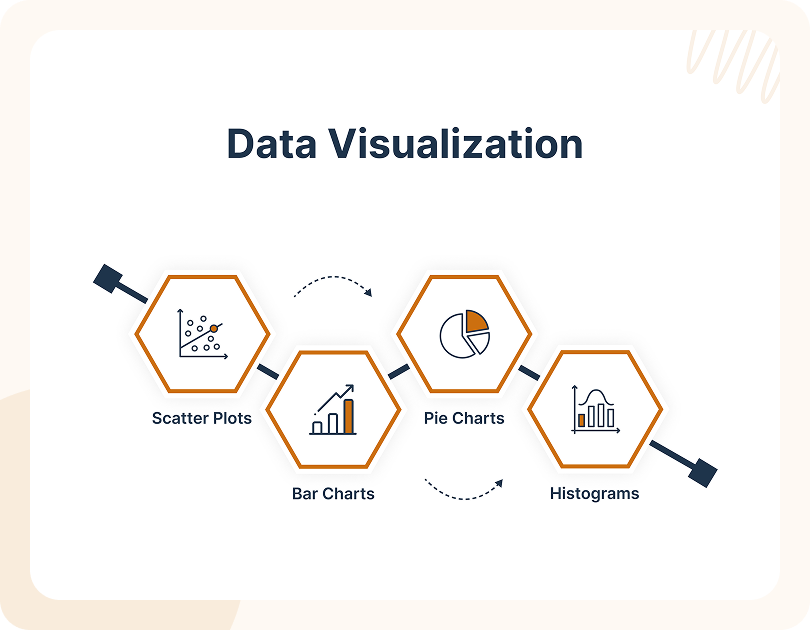
Data Visualization
- Using scatter plots, bar charts, pie charts, and histograms to create visual representations of data that can be used to spot trends, patterns, and outliers.

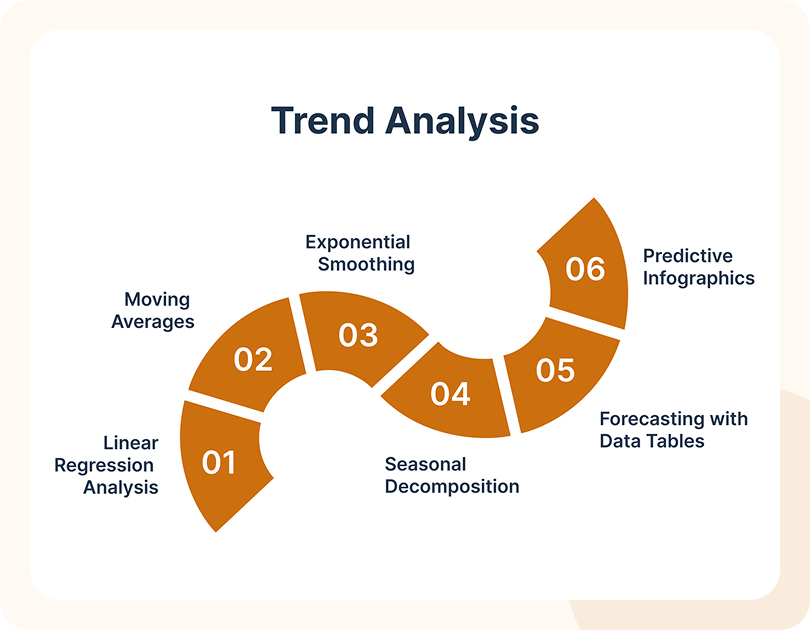
Trend Analysis
- The process of analysing data over time to identify and make sense of cycles, patterns, and seasonal changes.
- Analysis of data over time to detect and interpret patterns, cycles, and seasonal variations.
Inferential Statistics
Hypothesis Testing
Conducting tests like t-tests, chi-square tests, ANOVA, TOST and regression analysis (linear, stepwise, polynomial and logistic) to draw conclusions about population parameters based on sample data.
Confidence Intervals
Estimating population parameters with a range of values derived from sample statistics, providing an indication of the reliability of estimates.
Correlation
Correlation is a tool used to evaluate the correlations between variables. Granger causality tests are one method used to find possible causal relationships.


Tell Us About Your Project
Our team of experienced professionals at Graphtal is ready to transform your project from idea to
reality, ensuring alignment with your organisation goals through advanced data analytics and
predictive modelling.

Let's simplify your work
Want to make Insightful Analytics for Smarter Decisions?
Let's connect.


